Explore actionable insights with Tableau-powered visualizations. These interactive dashboards showcase trends in subscription plans, revenue generation, and user sign-ups, helping businesses make data-driven decisions.
Key Benefits
Forecast Sales
Predict future signup and revenue trends.
Optimize Strategies
Adapt marketing efforts based on real data.
Enhance Growth
Identify opportunities and mitigate risks.
Gain Actionable Insights
Use data-driven recommendations for smarter decision-making.
Simple Steps to Analyze Sales Trends
Gather Data
Collect subscription and revenue data over time.
Visualize Trends
Use Tableau to create insightful dashboards and spot patterns.
Plan Action
Leverage insights to adjust pricing, improve retention, and maximize revenue.
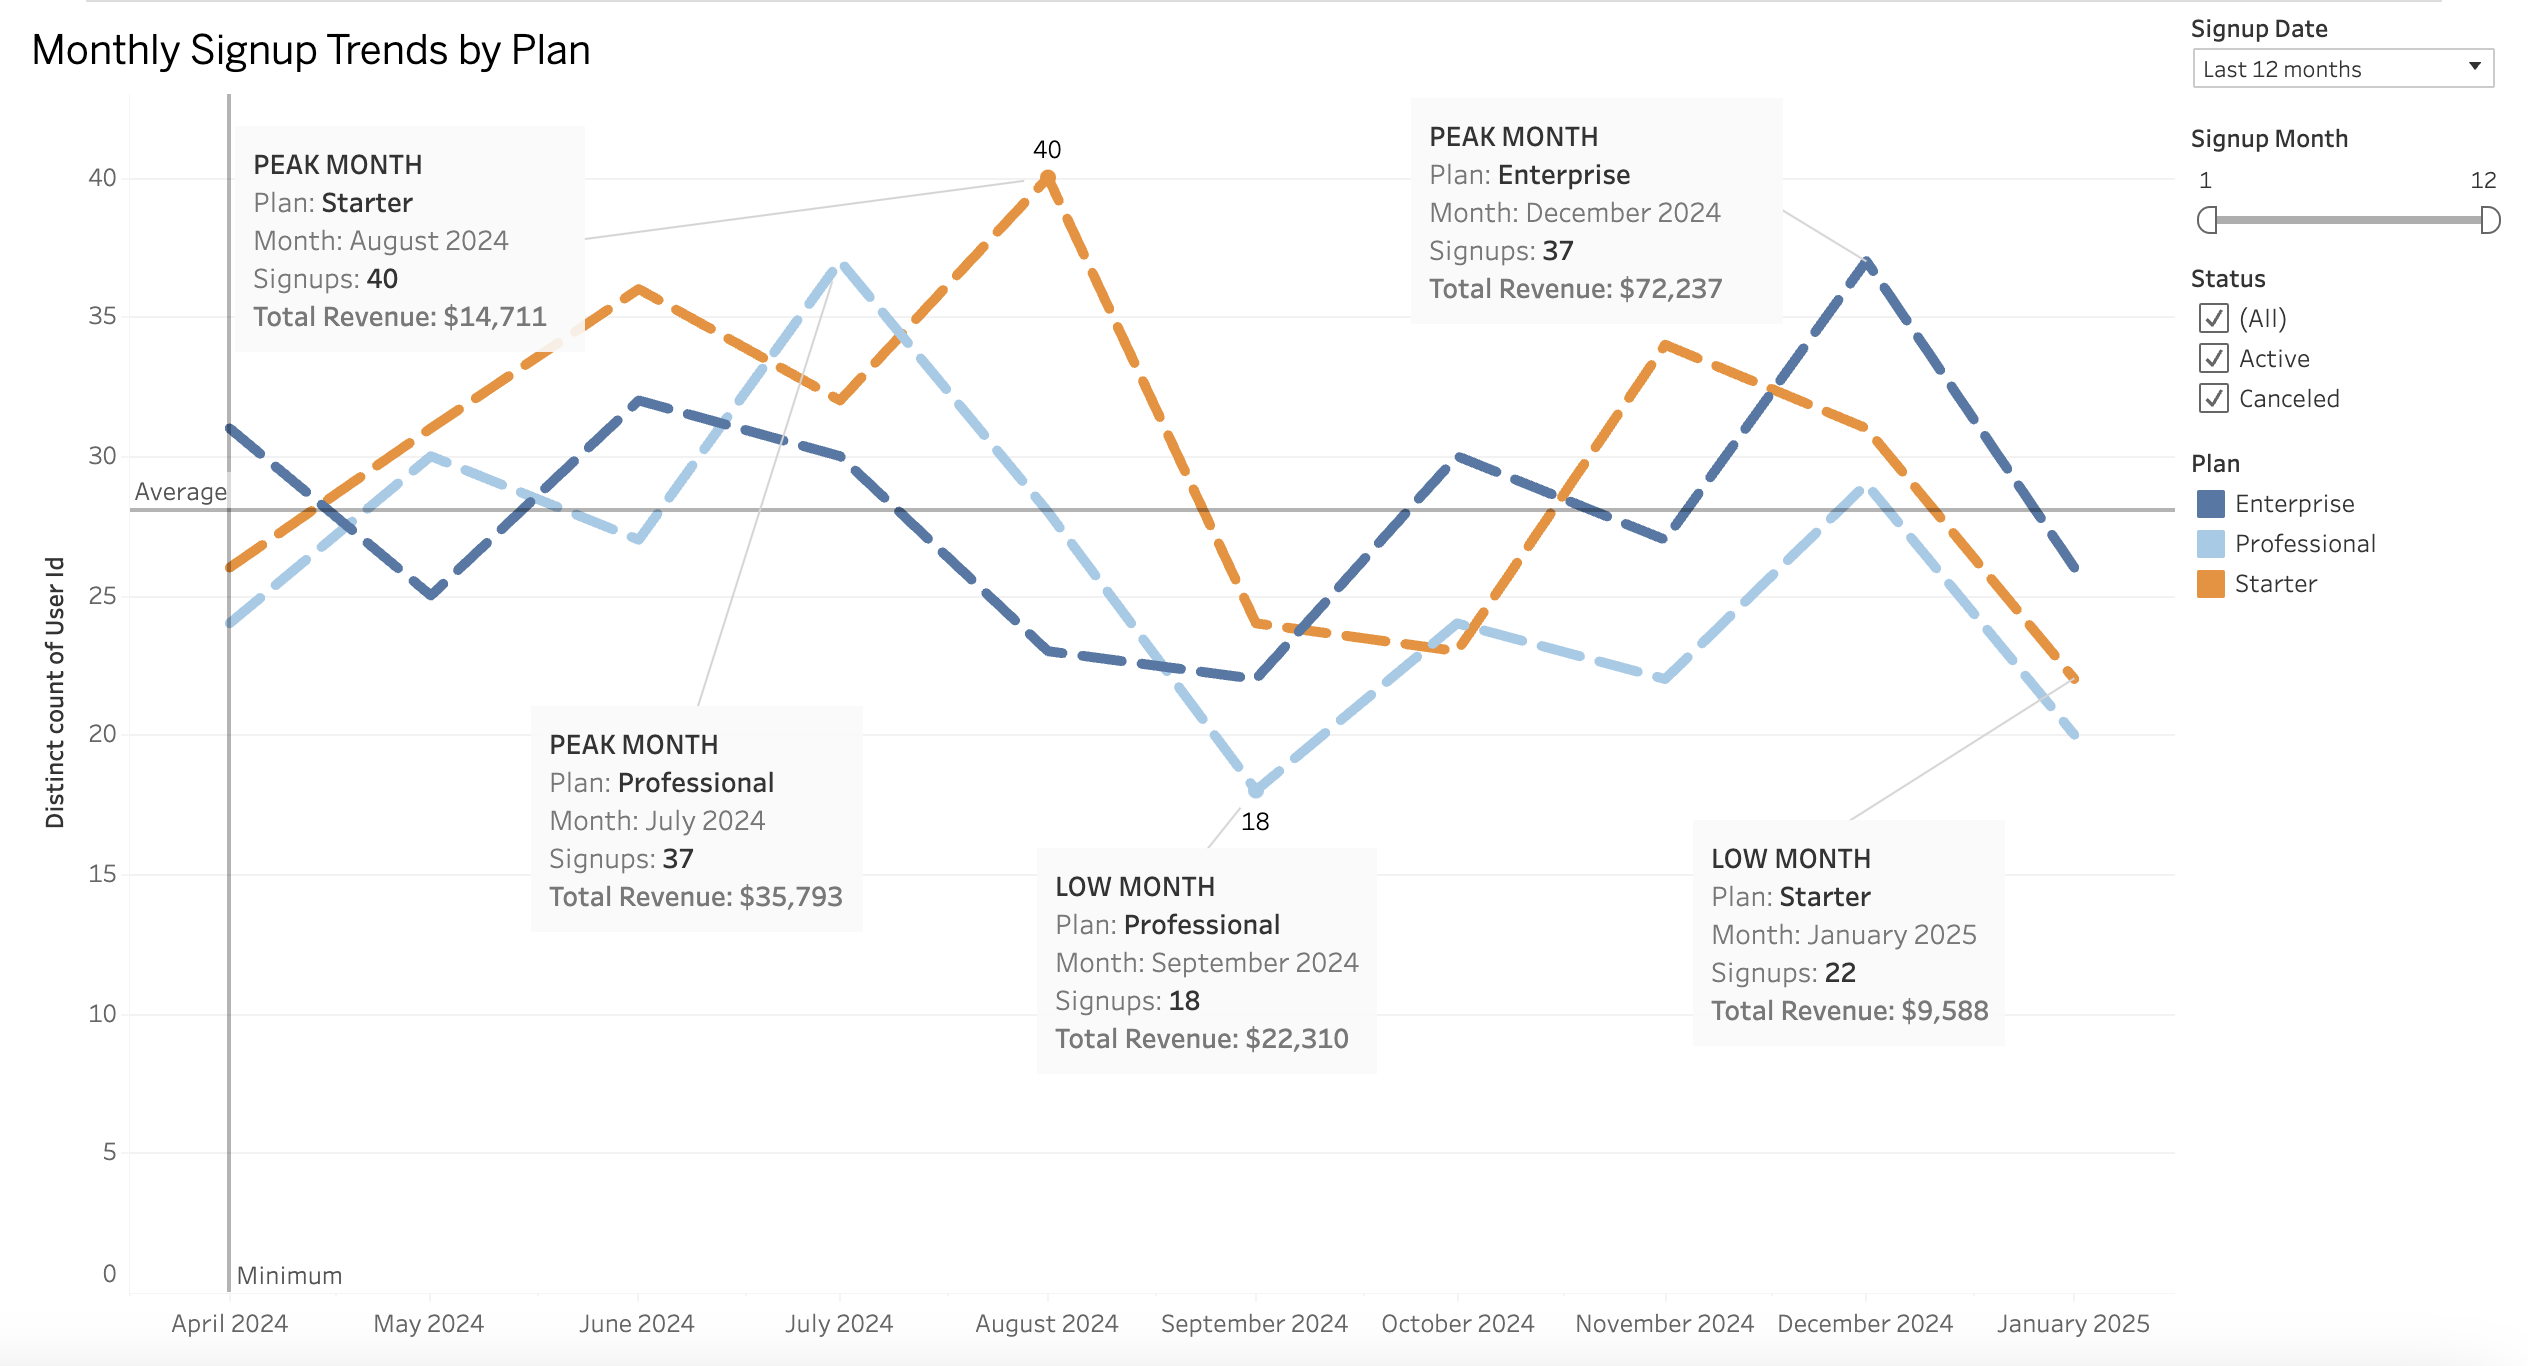
Interactive Data Visualizations
Explore actionable insights with Tableau-powered visualizations. These interactive dashboards showcase trends in subscription plans, revenue generation, and user sign-ups, helping businesses make data-driven decisions.
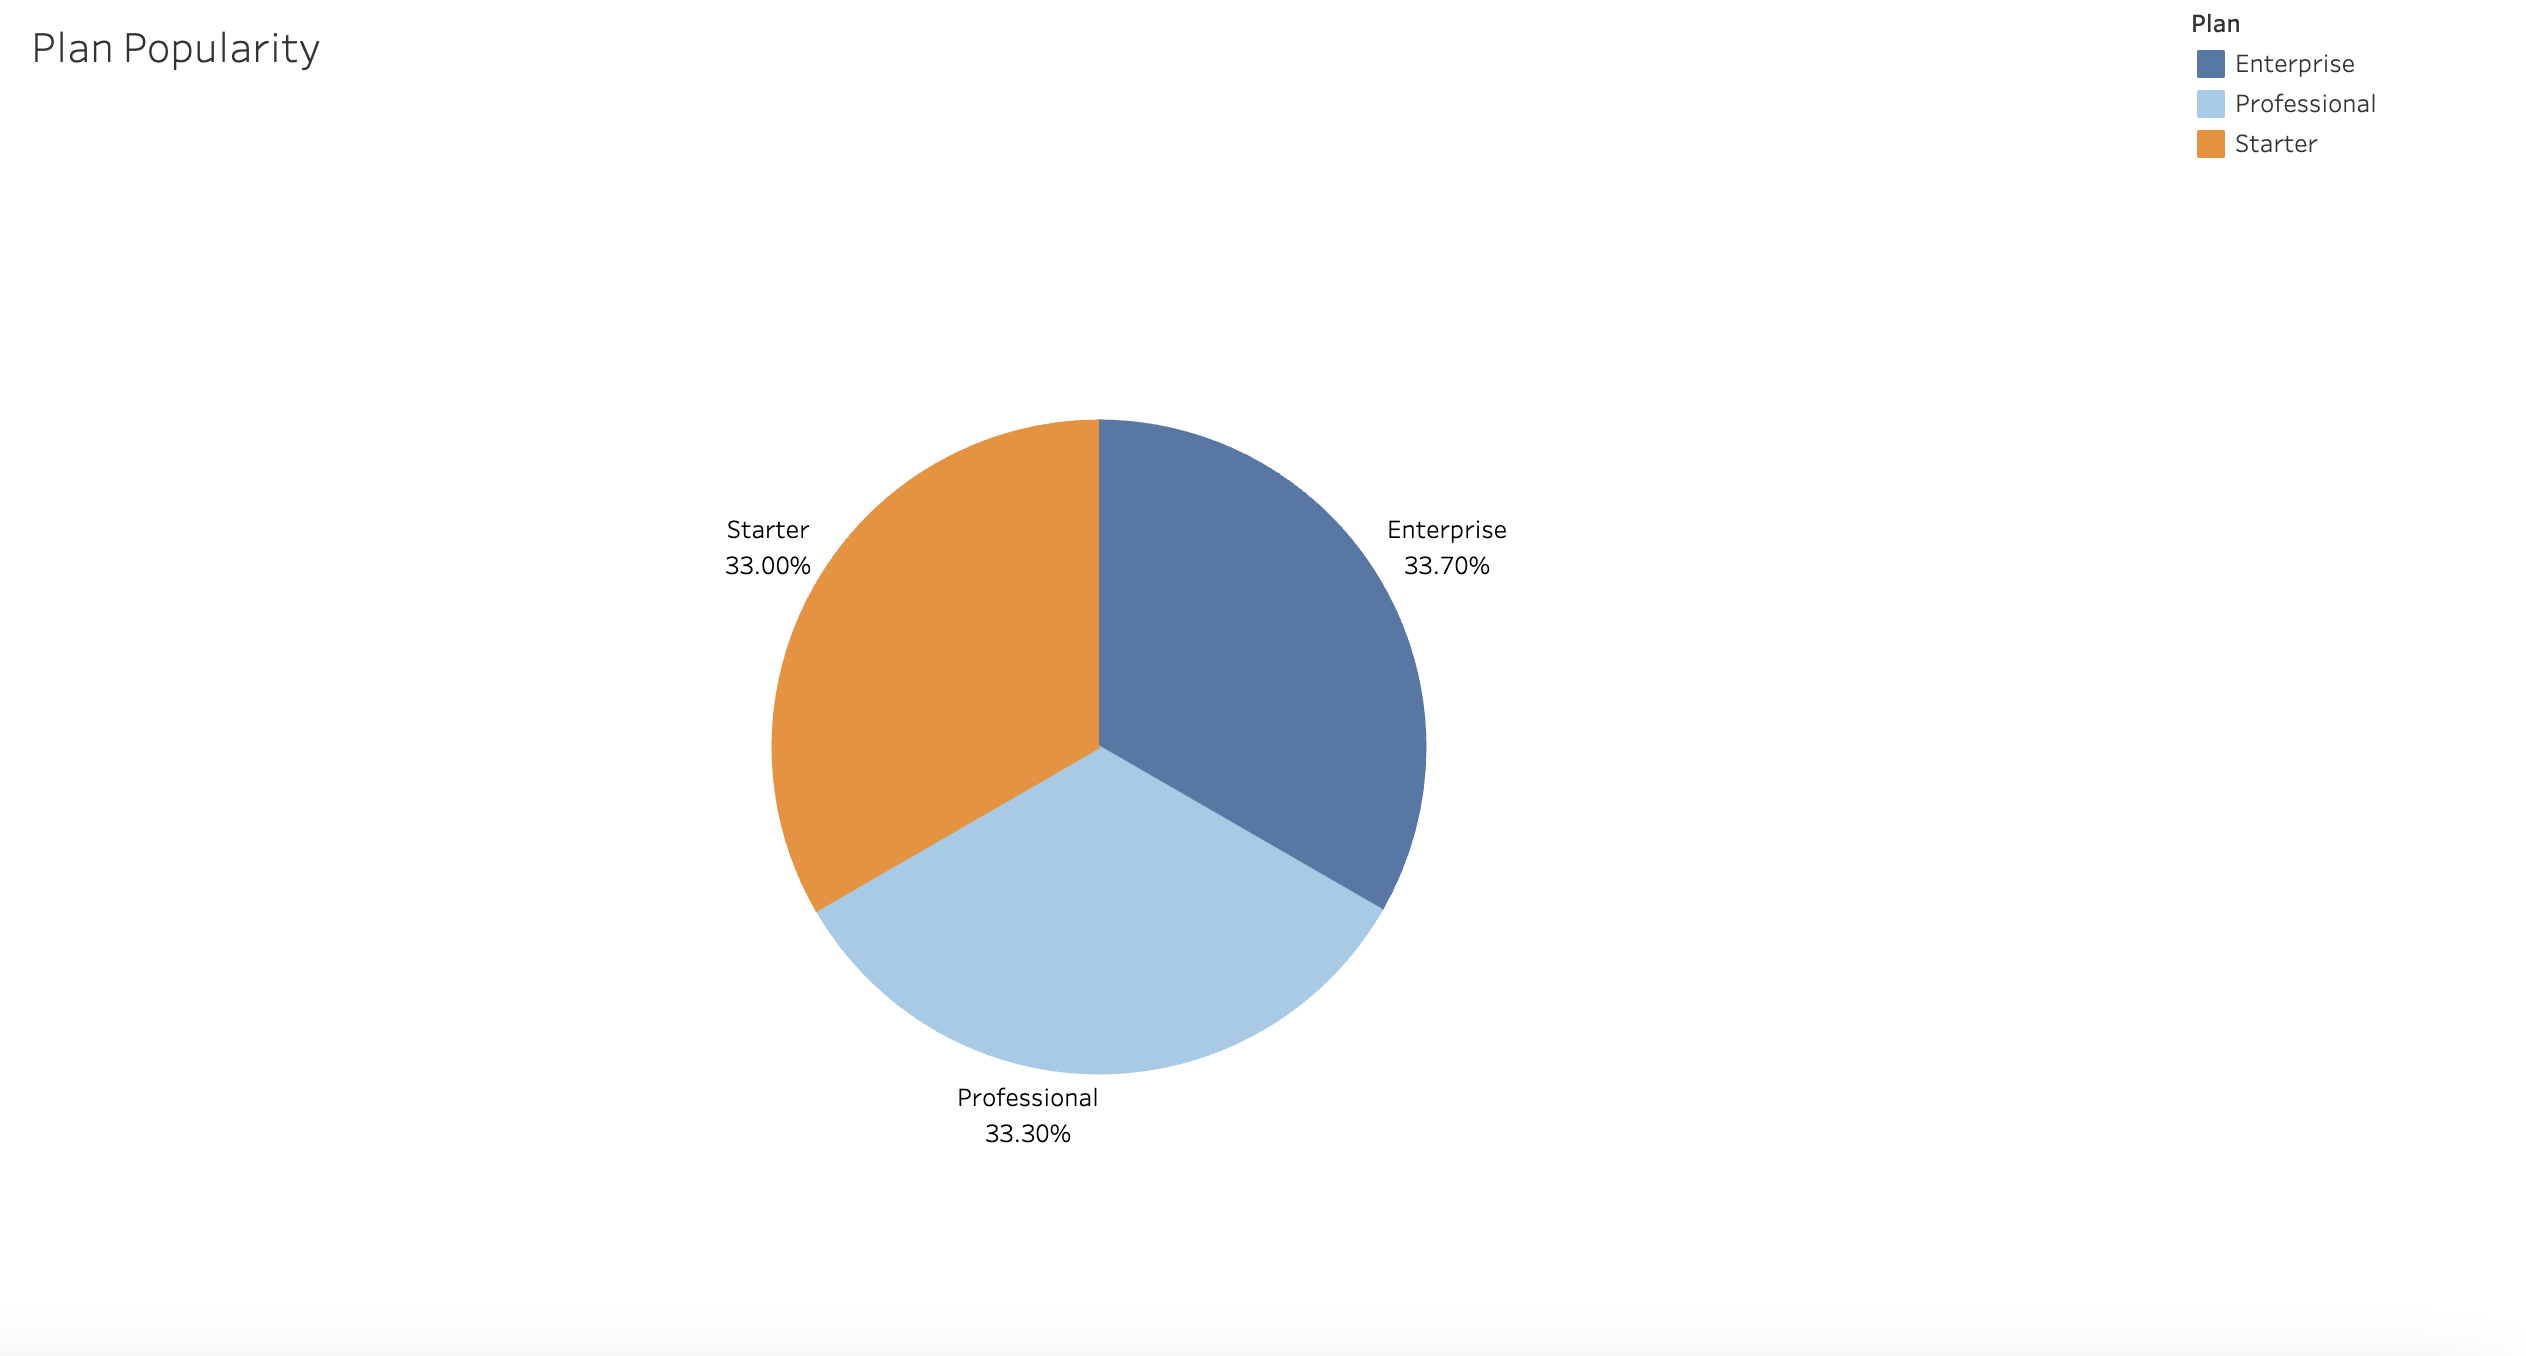
Plan Popularity Analysis
Understand the distribution of users across different subscription plans.